This section examines the environmental and climate dimensions of the transition and assesses whether renewable energy expansion translates into avoided emissions, reduced pollution, improved resource efficiency and strengthened climate resilience, or whether environmental pressures are merely shifted rather than reduced.
Together, the indicators provide a system-level view of whether renewable energy is contributing to ecological regeneration and long-term environmental stability rather than serving as a parallel energy supply within an otherwise unsustainable system.
Addressing these crises is not only an ecological imperative, but an economic one. The costs of inaction far exceed those of deploying renewables, and the health, infrastructure and ecosystem damages avoided through the energy transition can represent enormous gains for societies and economies alike33. There is a need to track how a renewables-based economy delivers on these benefits, and what regulations and enabling conditions are already contributing or are still needed to fulfil this goal.
This first edition of the RBE Tracker focuses on a set of four indicators: the integration of renewables in national climate plans, energy-related carbon dioxide emissions, circularity, and siting and permitting policies. Future iterations may include more indicators such as (avoided) costs of extreme weather events and pollution-related diseases.
Of the Third Nationally Determined Contributions (NDCs)4 that countries submitted to the United Nations by the end of 2025, 99% included measures that address Sustainable Development Goal 7, highlighting the central role of sustainable energy for advancing climate action.5 Similarly, around 90% of both the 109 submitted Third NDCs and the 85 submitted National Adaptation Plans (NAPs)6 as of March 2026 refer specifically to renewable energy.7 Renewables are recognised primarily for supporting climate change mitigation across sectors (offering opportunities for emission reductions), but also increasingly for climate change adaptation, enhancing resilience to droughts, heatwaves and sea-level rise while creating income opportunities.
By sector, renewables are most often mentioned alongside agriculture in climate change policies, accounting for 31.1% of co-mentions in NDCs and 41.4% in NAPs, often in the context of solar irrigation solutions and farming.8 This reflects both the particular vulnerability of agriculture and food systems to climate change and the potential for renewables to strengthen resilience and adaptation in the sector.9 Yet, only 31 national renewable energy policies for agriculture were in place by early 2026, indicating a broader lack of alignment across climate and energy policy (see Energy Demand and Electrification section).
Renewables and healthcare represent the second most common sectoral pairing in NAPs, accounting for 18.2% of all sectoral co-occurrences.10 In NDCs, the second most frequently co-referenced sectors are renewables and transport, appearing together in 28.1% of sectoral co-occurrences and encompassing eight transport-specific renewable energy targets.11
On a regional basis, NDCs in African countries link renewables and agriculture more frequently than NDCs in other regions. In Europe and Latin America, renewables are most often associated with transport in NDCs, while in Australia, Canada, Mexico, and South Africa, they are tied to industry. In contrast, in their NAPs, most countries, especially climate-vulnerable ones, highlight renewables for agriculture. This growing recognition underscores renewable energy’s role as a crucial adaptation measure, particularly in developing countries and small-island states, by helping decentralise and strengthen energy system resilience.
When assessing how renewables are integrated across broader policy frameworks, significant data gaps remain. Current analysis focuses primarily on renewable energy integration in climate strategies, whereas policies related to biodiversity, land use and disaster risk reduction are not yet systematically covered. Beyond expanding the scope, there is a need for more qualitative assessment of how renewables are embedded in these strategies, including their specific roles in mitigation, adaptation and ecosystem management. Existing tracking also remains largely limited to national-level policies, overlooking sub-national and local planning where implementation often occurs. In addition, differences in terminology, inconsistent reporting formats and limited transparency in policy documents hinder comparability across countries.
Since 2010, the share of modern renewables in total final energy consumption has increased around 70%, reflecting steady deployment across power, heat and transport. Over the same period, global carbon dioxide emissions have risen around 15%, with only a temporary drop in 2020. This divergence highlights a structural gap: although renewable energy is expanding rapidly, much of this growth is occurring alongside rising overall energy demand, rather than fully displacing fossil fuels at scale.
At the same time, the additional energy supplied by renewables has helped meet growing electricity and energy needs that would otherwise likely have been covered by fossil fuels or other non-renewable sources. Renewables deployment has proven effective at reducing greenhouse gas emission. In China, power-sector CO₂ emissions fell 1.5% in 2025, driven by renewable energy growth rather than weak demand, as solar output surged 43% and wind 14%. In India, emissions from the power sector declined by 3.8% over the same year, driven by coal power generation drop and record additions of 38GW of solar and 6.3GW of wind122. Even so, globally, continued growth in energy demand, persistent fossil fuel use in end-use sectors and slow system-wide integration of renewable energy are limiting the overall impact of renewables on emission reductions. Closing this gap will require not only accelerating deployment but ensuring that renewable energy directly displaces fossil fuel use across the entire energy system.
Unlike fossil fuel-based energy systems, which require the continuous extraction and combustion of polluting fuels, most renewable energy technologies operate without fuel inputs once they are deployed. However, building the infrastructure and enabling technologies for renewables – from solar panels and wind turbines to batteries, transmission and distribution grids – requires materials. Some of these materials are already in wide use, such as copper and aluminium, while others are only recently being used at scale, such as lithium and rare earth elements.13
Circularity practices – such as designing for re-use, repurposing and recycling across the full life cycle of renewable energy technologies – maximise resource efficiency and reduce the extraction of finite raw materials. When well implemented and regulated, these practices generate tangible economic returns, create value and jobs, and increase the resilience of supply chains and material sovereignty – representing an emerging component of the renewables-based economy.14
Bioenergy, when grounded in the cascading principle15, ensuring sustainable agricultural practices and avoiding deforestation, can offer an additional circularity pathway by valorising organic residues across successive uses before final energy recovery.16
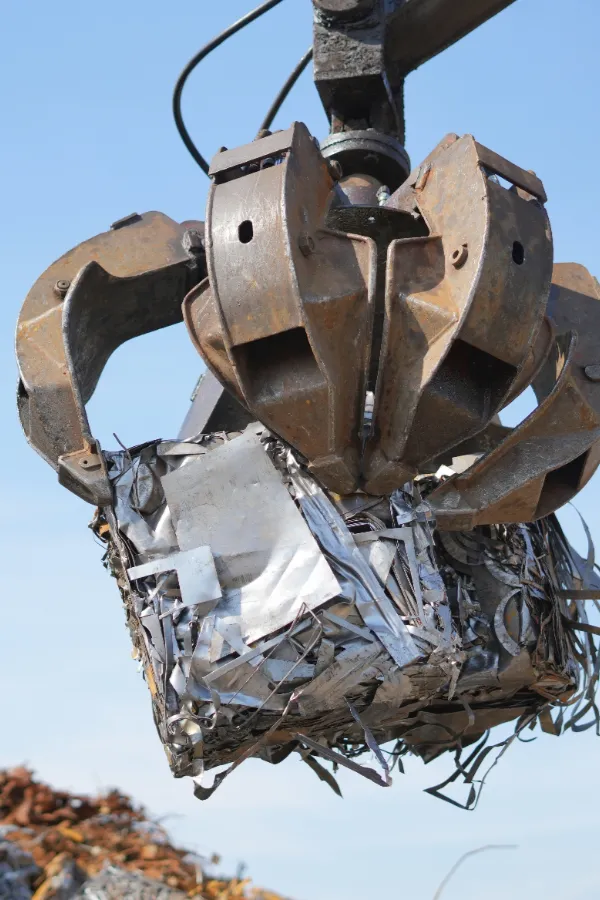

Key circularity metrics include recycling rates of materials used in renewable energy technologies, which reveal how effectively resources are kept in circulation, as well as policies that address the end-of-life of renewable energy components, including collection schemes, extended producer responsibility, and mandated re-use or repurposing obligations. The monetary value created through circular loops such as recovered materials, avoided procurement costs and secondary market revenues can help in quantifying the economic case for circularity.
End-of-life recycling rates for materials used in renewable energy technologies vary sharply. Metals that have historically been used in large volumes, such as copper and aluminium, have achieved medium to high recycling rates, supported by established waste management infrastructure and regulation.17 In contrast, for materials that are being newly used at scale – such as lithium, cobalt and rare earth elements – the recycling of end-of-life products remains nascent.18 In many instances, recycled inputs remain scarce simply because most renewable energy infrastructure and enabling technologies have not yet reached their end-of-life.19
For most materials used in renewable energy and enabling technologies, recycling faces structural economic barriers. For example in the United States, the cost of recycling solar panels exceeds that of landfilling, as well as the cost of bulk materials.20 There is a need for policy frameworks that incentivise recycling and make it competitive with primary extraction.21
In a sample of 22 countries studied by the International Energy Agency, policy measures implemented during 2022-2024 included: strategic plans setting recycling targets; extended producer responsibility schemes requiring manufacturers to implement end-of-life collection and recycling; financial incentives to stimulate recycling investment; and cross-border trade regulations governing scrap and waste flows.22 Some policies also included regulatory mandates such as minimum recycled content targets, collection rate requirements and landfill bans.23
Circularity in the renewable energy industry is usually covered by broader waste management policies that do not solely target renewables. For example, regulations aimed at managing waste from electrical and electronic equipment (WEEE), including extended producer responsibility (EPR) schemes, usually cover the end-of-life of batteries and solar PV panels.
Further action is needed to establish a comprehensive global database that enables the tracking of policies for circularity applying specifically to renewable energy industries.
There is no coherent global tracking of circularity of the materials used in renewable energy and enabling technologies. For some minerals, such as lithium, cobalt and rare earths, reliable time-series data on secondary supply are rarely publicly available, and systematic data on recycling capacity and recovered volumes are absent in most regions outside the United States and EU.24
Data on the monetary value of circularity practices in the renewable energy industry are mostly unavailable, inconsistent and difficult to cross-check. Market reports from various recycling industries (copper, aluminium, lithium) vary widely in their value assessments. Furthermore, most available data do not provide a breakdown by end-use, making it impossible to identify what portion applies to renewable energy infrastructure.25
Currently, the siting, permitting and sustainability requirements of renewable energy projects are governed primarily by broader environmental and infrastructure laws. Environmental impact assessments (EIAs) serve as a primary tool for evaluating potential impacts and informing approval decisions.
Policies that specifically address the sustainability requirements of renewables have evolved alongside technological deployment and have become more common in recent years. They aim to ensure that renewable energy deployment does not compete with other land uses (such as agriculture and forests) and to prevent potential negative impacts on local biodiversity (land, air, water) and local communities. Policy examples include protected biodiversity areas, restrictions on bioenergy feedstocks to prevent deforestation, maximum agricultural land-use change guidance for agrivoltaics, distance of wind turbines from dwellings and mandatory consultations with local communities.26
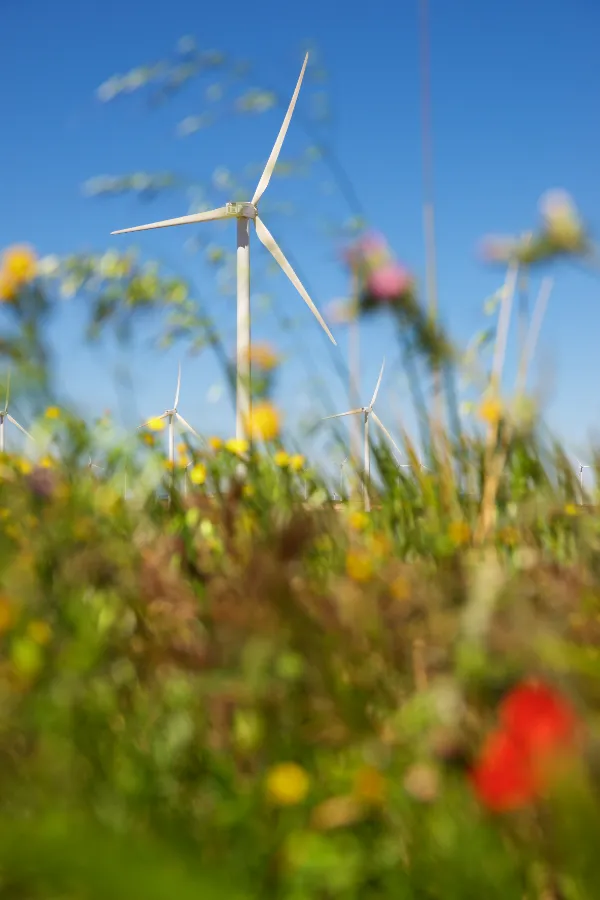
In response to the climate emergency and recurring energy crises, new policies increasingly aim to streamline regulations and accelerate the expansion of renewable energy. These include, for example policies defining acceleration areas or establishing simplified procedures for permitting processes, which can be coupled with nature-positive or net biodiversity gain requirements.27
.webp)







.svg)
.svg)