This section examines the economic dimensions of the transition by distinguishing between capital mobilisation and economic value creation. It assesses whether renewable energy investment translates into value added, industrial development, quality employment and fiscal alignment, or whether economic benefits remain limited by import dependence, high financing costs or continued support for fossil fuel incumbents.
Together, the indicators provide a system-level view of whether renewable energy is becoming a foundational economic driver rather than a stand-alone investment category.
While investment captures the scale and momentum of deployment, it does not by itself indicate whether renewable energy is reshaping industrial production, transport systems, trade patterns or domestic value chains. A renewables-based economy emerges when renewable energy becomes embedded across these broader economic structures, reducing import dependence, creating new industrial opportunities and strengthening long-term resilience.
Increasingly, the transition is being driven not only by climate and energy objectives, but also by the growing economic advantages associated with renewable energy. Greater price stability, reduced exposure to fossil fuel markets and expanding domestic renewable energy capacity are reshaping competitiveness and influencing how countries position themselves within future energy and industrial systems.
The economic dimensions of the transition can be assessed through indicators related to investment, industrial development, employment, trade, fiscal policy and economic value creation. Together, these indicators provide insights into how renewable energy is reshaping economic activity, creating new industries and jobs, influencing trade patterns and contributing to long-term resilience and competitiveness.
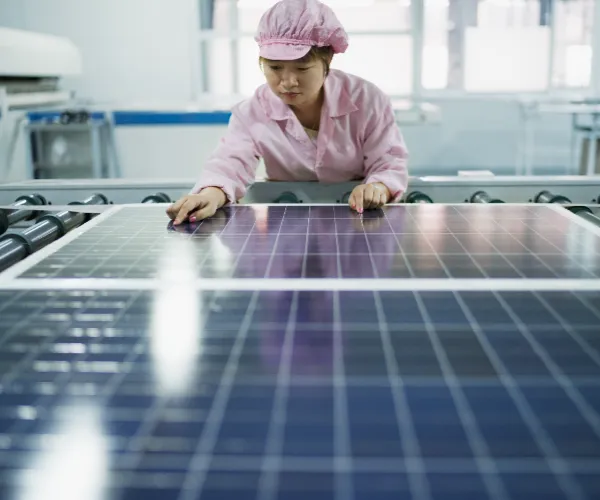
Global manufacturing of renewable energy and enabling technologies1 is expanding rapidly, although this growth varies widely across technologies and regions. The greatest capacity increases have occurred in solar PV and battery manufacturing, driven by strong investment, economies of scale and expectations of continued growth in demand. Currently, the announced manufacturing capacity in these two technologies exceeds projected deployment, contributing to downward price pressure and intensified global competition.
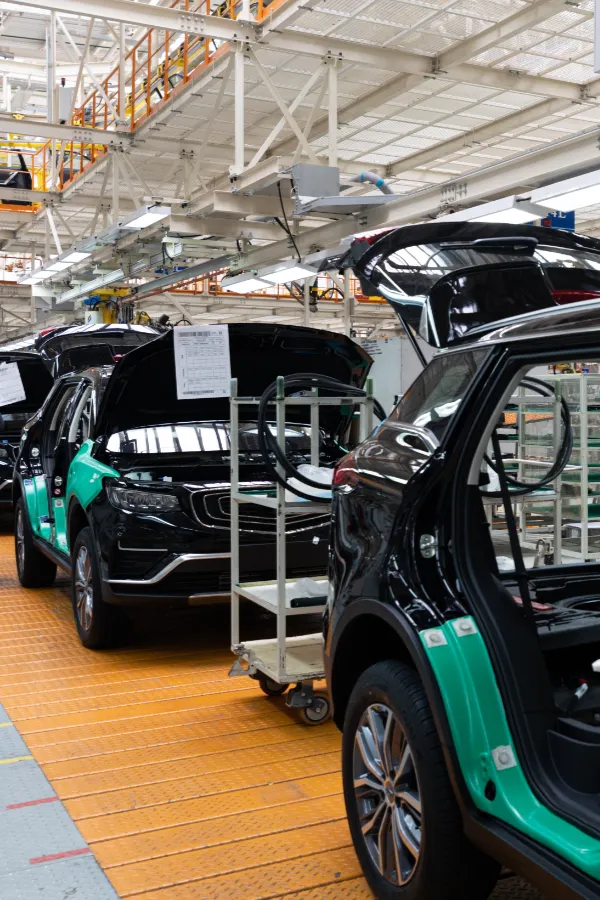
In contrast, wind energy manufacturing remains more closely aligned with deployment needs but continues to face supply chain and project delivery constraints. Heat pump manufacturing follows a different pattern, with production more regionally anchored and closely tied to local markets, standards and policy frameworks. Electric vehicle manufacturing has expanded rapidly in all major regions, as governments increasingly view transport electrification as both an energy transition objective and an industrial development opportunity.
These differences reflect distinct industrial dynamics across renewable energy and enabling technologies, with solar PV and batteries characterised by highly globalised supply chains, wind power relying on more project- and infrastructure-based value chains, and heating technologies representing more locally embedded manufacturing. At the same time, manufacturing capacity remains highly concentrated geographically, with China maintaining dominance across most technologies, particularly solar PV, batteries and electric vehicles. Europe and the United States play leading roles in wind and heat pump manufacturing, while India has expanded its position across several manufacturing segments. Though differing in scale and pace, industrial policy efforts in several regions aim to expand domestic manufacturing capacity, diversify supply chains and reduce reliance on geographically concentrated production.
Despite the growing visibility of renewable energy manufacturing capacity, significant data gaps remain across supply chains for renewables, limiting the ability to fully assess system readiness and resilience. Available data often focus on the final manufacturing stages, whereas upstream segments such as raw material extraction, processing and component-level production remain less transparent and are inconsistently tracked across regions. Information on trade flows, supply chain dependencies, bottlenecks and lead times is also fragmented, making it difficult to understand how disruptions or concentration risks propagate through the system. In addition, data on enabling components, including batteries, power electronics and critical grid equipment, are still evolving and are not systematically captured. Addressing these gaps will be essential to move from a partial view of manufacturing expansion to a more comprehensive understanding of supply chain developments and dynamics relevant for shifting to renewables-based economies.
Policy support for renewable energy manufacturing has expanded steadily over the past decade, evolving from a limited set of measures in the early 2010s to a more structured and growing policy landscape in 2025. Asia has led this expansion, with the highest and most sustained increase in cumulative policies, underpinning the region’s dominance in global manufacturing, particularly in solar PV. Europe has also strengthened its policy framework over time, and North America significantly increased manufacturing support through major industrial policy initiatives, most notably the Inflation Reduction Act, although the long-term direction of these policies has become more uncertain. In contrast, Africa, South America and Oceania have shown only limited and more recent engagement, with relatively few policies in place. These trends suggest that the global expansion of energy equipment manufacturing is being shaped by a small number of economies that have adopted sustained industrial policy frameworks, while many countries still have opportunities to develop domestic manufacturing capacity and capture a greater share of future energy value.
Worldwide, more than half of all countries have fiscal and financial policies that support renewable energy.22 However, policy uptake across these 114 countries (with 388 total recorded policies) remains highly uneven in both scope and depth.3 Around one-third of countries have adopted only a single fiscal or financial support instrument, whereas many high-income countries have multiple diverse measures in place, indicating a more comprehensive policy mix that addresses different barriers, actors and stages of renewable energy deployment.
Net metering4 was the most geographically widespread fiscal and financial instrument supporting renewables as of 2025, present in 56 countries.5 Net metering has become a common entry point for the adoption of distributed renewable energy, primarily benefiting households and small-scale producers able to connect to the grid. Feed-in tariffs, which operate at a different scale by guaranteeing fixed prices for grid-connected generation, are in place in 42 countries.6
Similarly, spending-based measures7 are broadly adopted, with public grants in place in 47 countries and public subsidies in 41 countries.8 These measures can be flexibly targeted, spanning households, businesses, and utilities, making them particularly important for reaching vulnerable or underserved groups that may lack the upfront capital to invest in renewables.9 Instruments such as tax credits, competitive tenders and loans are less widely adopted, reflecting their dependence on specific market conditions, administrative frameworks or private sector capacity to engage with them effectively.
At the same time, fossil fuel subsidies remain deeply embedded in energy and economic systems, reflecting longstanding policy choices that continue to prioritise fossil-based energy. Governments maintain a wide range of support mechanisms, including tax exemptions, regulated pricing and direct transfers, which are often expanded in response to price volatility but are rarely fully phased out. These measures persist across economies, reinforcing structural dependencies, distorting energy markets and delaying the transition away from fossil fuels.10 In many low- and lower middle-income countries, fossil fuel subsidies remain in place as a means of maintaining energy affordability and access, where the underlying challenge is less one of policy choice and more one of insufficient finance to make unsubsidised renewable energy viable at scale.11
By contrast, public support for renewable energy is designed primarily to enable investment and build new markets. Grants and concessional finance have contributed to scaling deployment, although their reach remains uneven: in many developing countries, these supports cover only a fraction of financing needs. Feed-in tariffs and premiums have driven growth in some contexts, yet their relevance varies by technology and market. Solar PV has reached cost-competitiveness in many countries, whereas larger infrastructure such as offshore wind and hydropower continues to depend on price support.
Overall, public support for renewable energy remains fragmented and insufficiently scaled relative to fossil fuel subsidies, and political commitment to maintaining it cannot be taken as given. In most countries, fossil fuel subsidies continue to exceed support for renewables, although this pattern is most clearly evidenced in larger economies and may not fully reflect the dynamics across the broader range of lower- and middle-income countries. Moreover, estimations of direct subsidies to fossil fuels do not account for the actual costs to society due to the harm these fuels create, such as contribution to climate change through greenhouse gas emissions, pollution, and health damages (premature deaths). Together, these costs exceed by far explicit subsidies, accounting for an estimated $6.7 trillion in 2024.12
Trade policies related to renewable energy and enabling technologies have increased sharply in recent years. In 2015, only 9 formal trade measures related to renewables and enabling technologies were in place; by 2024, this number had surged to 212, doubling from 2022 and including measures related to solar PV (more than 50 policies), battery components (more than 50), electric vehicles (47), wind turbines (32) and heat pumps (16).13 Nearly 40% of new trade policies since 2020 involved tariff changes, anti-dumping measures and countervailing duties, while half of energy-related critical minerals are regulated by export controls.14 Over the same period, around 50 new free trade agreements have been signed, most of them maintaining preferential tariffs for renewables and enabling technologies.15
Investment trends for renewable and low-emission energy technologies show continued expansion but also increasing divergence across technologies and segments.
Global spending on electrified transport16 has risen sharply, from around USD 305 billion in 2021 to nearly USD 900 billion in 2025, making it the fastest growing segment. By contrast, investment in renewable power peaked at USD 762 billion in 2023 and slowed to around USD 690 billion in 2025, following several years of rapid growth.17
Investment in power grids increased steadily, from USD 323 billion to USD 483 billion between 2021 and 2025. At the same time, energy storage investment grew sharply, from USD 8 billion to USD 71 billion during the same period.
Other sectors have shown more uneven trajectories. Clean hydrogen's18 annual investment rose to USD 13 billion in 2023 before falling to USD 7 billion in 2025, while clean industry19 investment peaked at USD 53 billion in 2023 and dropped to USD 34 billion in 2025. Heat pump investment held relatively stable, at USD 80-85 billion annually, and clean shipping remained marginal, at only USD 4 billion in 2025.
Overall, investment growth is concentrated in electrified transport, while other parts of the system –particularly grids, storage and clean industry – are expanding more slowly or inconsistently. This uneven distribution highlights a growing misalignment between where capital is flowing and what is required to support a fully integrated, renewables-based energy system.
Financing conditions play a critical role in shaping the pace and distribution of renewable energy deployment across countries. While the cost of capital has fluctuated over time, clear structural differences persist among income groups. Higher-income economies consistently benefit from lower financing costs, reflecting more stable macroeconomic conditions, stronger financial systems and lower perceived risk. In contrast, lower- and lower middle-income countries face much higher costs of capital20, often driven by currency volatility, limited access to affordable finance and higher perceived risk premiums. These disparities create uneven investment conditions, slowing renewable energy deployment in regions where growth potential is often highest. Addressing these financing-related challenges is essential to enabling a more balanced equitable and accelerated transition to a renewables-based economy.
Estimating the contribution of renewable energy to gross domestic product (GDP) remains challenging due to significant data gaps and methodological limitations. Renewables contribute to economic activity through multiple channels that extend well beyond energy generation itself. Direct contributions include the construction, installation and operation of renewable energy assets, as well as manufacturing of equipment and infrastructure. Indirect contributions arise across supply chains, including mining and materials processing, component manufacturing, transport, engineering, finance, digital services and maintenance activities. Induced impacts emerge through wider economic effects, such as increased household spending linked to employment creation, lower energy costs for businesses and consumers, improved trade balances from reduced fossil fuel imports, and enhanced industrial competitiveness associated with access to low-cost electricity. Together, these effects position renewables not only as an energy technology, but as an increasingly important driver of economic growth, industrial development and investment attraction.
Despite this growing economic relevance, current national accounting systems capture only part of the value created by renewables-based economies. Existing estimates often rely on proxies such as investment flows, employment or sectoral output, which reflect only selected dimensions of economic activity. Gross investment figures, for example, do not measure domestic value-added and may overstate local economic benefits where projects rely heavily on imported technologies or foreign services. Conversely, many approaches underestimate renewable energy’s contribution by failing to capture upstream industries, long-term operation and maintenance activities, electricity price effects, avoided fossil fuel imports, tax revenues and wider spillover effects across the economy. This challenge is particularly important in countries where renewable energy deployment contributes to industrialisation strategies, export development or the expansion of domestic service sectors.21
Several critical data gaps continue to constrain more robust assessments. These include limited firm-level value-added data, insufficient tracking of domestic versus imported components, incomplete trade statistics for renewable energy supply chains, and weak disaggregation of renewables-related activities within national accounts and industrial classifications. In many countries, renewable energy activities remain embedded in broader construction, manufacturing or utility sectors, making them difficult to isolate statistically. These limitations are generally more severe in developing economies, where statistical systems often have lower sectoral granularity, less comprehensive industrial reporting and weaker coverage of informal economic activity. As a result, the contribution of renewables to GDP may be systematically undercounted in countries where local service provision, small-scale manufacturing or distributed renewable systems play an important role in the economy.
Some progress has been made in a limited number of countries, particularly in Europe, where environmental-economic accounting frameworks provide partial insights into the economic contribution of renewables. The European Union’s (EU) Environmental Goods and Services Sector (EGSS) accounts, aligned with the United Nations System of Environmental-Economic Accounting (SEEA), track gross value added, employment and exports associated with environmental activities, including renewable energy. Countries such as Denmark, Finland and the United Kingdom complement these frameworks with national methodologies that better capture renewable manufacturing, industrial activity and export-oriented value chains. Available estimates suggest that environmental and renewables-related sectors can contribute several percentage points of GDP in countries with strong domestic industries and supply chains. However, methodologies remain inconsistent across countries and often exclude broader system-wide impacts such as lower electricity prices, competitiveness gains, avoided fossil fuel imports and long-term service activities, limiting comparability and likely understating the full economic contribution of renewables.22
Improving measurement requires moving beyond narrow energy sector accounting towards a more integrated understanding of renewables as a driver of economy-wide transformation. This includes developing renewable energy satellite accounts, improving the granularity of input-output tables, strengthening trade and industrial statistics, and systematically tracking domestic value creation across manufacturing, services, infrastructure, public revenues and exports. Greater alignment across energy, industrial and macroeconomic statistics would also improve understanding of how renewables contribute to competitiveness, investment attraction, employment creation and economic resilience. Strengthening these statistical foundations is essential not only to better quantify renewables’ contribution to GDP, but also to understand how renewables are reshaping broader patterns of economic development and structural transformation.
Renewable energy employment encompasses jobs across manufacturing, installation, operation, and maintenance. Although jobs in renewables continue to grow, they remain concentrated in a few technologies and geographies. Global renewable energy employment reached nearly 17 million jobs in 2024, up from around 11 million in 2017, comprising both direct and indirect23 jobs from equipment manufacturing to the installation and maintenance of generating capacity.24 This represents approximately one in five energy sector jobs globally in 2024, a share that has increased as renewable energy employment is growing.25
The rising number of renewable energy jobs is driven primarily by solar PV, which accounted for more than 7 million jobs in 2024, or more than 40% of total global employment in the renewables sector.26 However, solar PV jobs are highly concentrated geographically: manufacturing capacity is largely held by a small number of countries, including China and other South-East Asian economies, whereas elsewhere solar PV jobs are mainly in construction, installation, and operation and maintenance.27
Other technologies show more modest or stable trends. Bioenergy remains the second largest renewable energy employer, with around 3.7 million jobs in 2024, while hydropower employment has plateaued at just over 2.2 million jobs.28 Employment in wind energy has grown gradually to nearly 2 million jobs in 2024 but remains significantly lower than solar PV.29
Despite record capacity additions, growth in renewable energy employment has slowed, moderated by rising labour productivity, economies of scale, and automation, particularly in China, while the link between deployment and job creation remains strong across many other countries.303 Geographically, China accounted for 43.9% of global renewable energy jobs in 2024, and its dominance in equipment manufacturing is slow to change, given the depth of its manufacturing ecosystem and considerable cost advantages, posing challenges for new entrants seeking to scale up and succeed.31 Beyond geographic concentration, workforce diversity remains a persistent structural gap.32
While renewables are creating jobs at scale, these are unevenly distributed across technologies, value chains, and geographies, both within and across countries, and down to the local and regional level. Limited access to training infrastructure, particularly in remote areas, further widens these gaps, pointing to the need for more diversified, regionally distributed employment opportunities and locally anchored skilling strategies as part of a renewables-based economy. Across energy sectors, women remain underrepresented relative to the broader economy: they account for 32% of renewable energy jobs and just 23% in oil and gas, compared with a global economy average of 43%.33
Across energy sectors, women remain underrepresented relative to the broader economy: they account for 32% of renewable energy jobs and just 23% in oil and gas, compared with a global economy average of 43%.
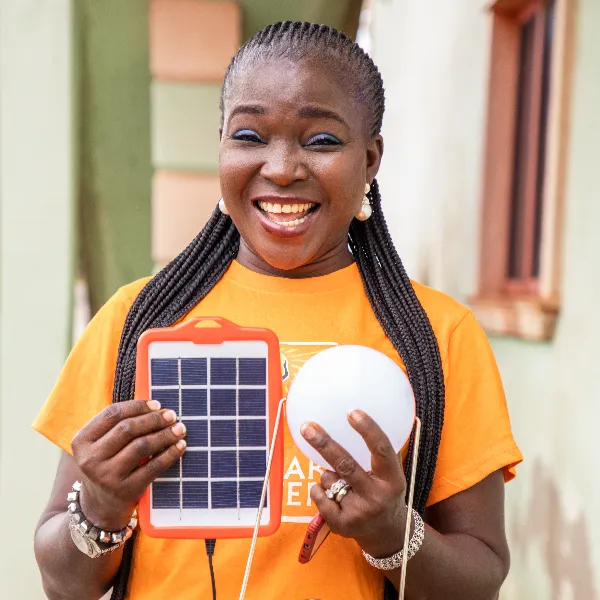
Across the renewable energy value chain, women are most represented in policy and administration roles, holding around 40% of these positions as of 2025, whereas women hold only around a quarter of operation, maintenance and manufacturing jobs.34 The type of employer also shapes representation in renewables: women’s share is highest in associations and public enterprises, and lowest in private companies.35 Policies, education and training opportunities are required to support an increasing share of women in the renewable energy sector, since a renewables-based economy that fails to harness the full potential of women is a transition that falls short of its own ambitions.
Effective education, training and skilling are essential to building a workforce that is capable of driving the shift to a renewables-based economy. Acute skills shortages risk constraining growth across the entire renewable energy value chain, from manufacturing and installation to operation and maintenance, while the sector’s expansion also demands expertise in energy governance, finance, law and community development.36 Digitalisation and artificial intelligence are further reshaping skill requirements, as renewable energy operations become more automated, making preparation for a simultaneous digital and energy transition increasingly urgent. This requires co-ordinated workforce development aligned with industry needs and supported by labour market policies, public investment and industrial strategies to ensure that no worker or region is left behind.
43 countries have adopted 52 policies supporting workforce reskilling for the energy transition.
Particularly in regions with a large fossil fuel workforce, upskilling and reskilling represent an increasingly urgent dimension of workforce development, required across the full renewable energy value chain, from critical mineral mining and refining to downstream manufacturing, installation, operation and maintenance, and end-of-life recycling. As of 2026, a total of 56 policies worldwide supported worker reskilling for a just energy transition, with the majority still at the strategy and roadmap stage, suggesting that concrete implementation remains limited.37 Policies are largely concentrated in high-income countries, particularly in Europe, where the EU’s Just Transition Fund channels financing to Member States once they present their Territorial Just Transition Plan, which typically identifies coal-dependent regions and outlines targeted investments in worker retraining, economic diversification and the shift towards renewable energy.38
An example of a comprehensive roadmap is the United Kingdom’s clean energy jobs plan, released in October 2025, which commits to various financial incentives ranging from around USD 27 (GBP 20 million) to aid the transition of North Sea workers to renewable energy sectors, to more than USD 135 (GBP 100 million) for an Engineering Skills Package supporting clean energy occupations.39 Among developing countries, Viet Nam’s commitments under the Global Coal-to-Clean Power Transition Statement outline training and retraining programmes for workers at coal-fired power plants, livelihood support for affected communities, and co-operation to develop high-quality engineering and technical staff for the renewable energy industry.40 South Africa, meanwhile, offered five reskilling policies as of 2026, including roadmaps such as the Just Energy Transition Implementation Plan 2023-2027, which defines short- and medium-term outcomes across nine defined Portfolios, including the Skills Portfolio.41
Although data availability on renewable energy employment has improved in recent years, gaps remain. Headline job figures are increasingly tracked, but far less is known about job quality and how well skills align with evolving industry needs. Evidence on the effectiveness of reskilling efforts is still limited, particularly regarding whether programmes reach fossil fuel workers, respond to labour market demand, and lead to stable, long-term employment. In addition, the links between renewable energy deployment and employment outcomes along the value chain are not systematically captured, and data on inclusiveness across different social and geographic groups remain scarce.








.svg)
.svg)